Turn Off Ads?
Results 1 to 10 of 10

Thread: fangraphs article on Jay Bruce

  1. #1
    Member Will M's Avatar
    Join Date
    Apr 2006
    Posts
    4,544

    fangraphs article on Jay Bruce

    FYI

    http://www.fangraphs.com/blogs/index...ting-jay-bruce

    Jay Bruce so far, in two major league seasons, has a .328 career wOBA in 839 plate appearances. As such, one might be surprised to see the following Bill James projection on his player page:

    .274 AVG, .340 OBP, .537 SLG, .373 wOBA

    Given what we’ve seen of Bruce in the majors, this projection seems a little bit ridiculous. James projects Bruce to pick up 45 points of wOBA. His projections have been known to be a bit optimistic for some offensive players. Is this another one of those cases?

    Let’s compare Jay Bruce’s 2009 to his projected mark for 2010.

    2009: 9.9 BB%, 21.7 K%, .303 OBP, .470 SLG, .246 ISO, .222 BABIP, .329 wOBA
    2010: 8.9 BB%, 22.0 K%, .340 OBP, .537 SLG, .263 ISO, .290 BABIP, .373 wOBA

    There’s really only one major difference there, and that’s his BABIP. Bruce’s BABIP is one of the more interesting anomalies in the game, as I explored over at Beyond the Boxscore earlier in the season. As a quick summary, Bruce’s BABIP on line drives and fly balls in particular has been particularly low for his whole career, and he’s had more than 20 fewer hits on those two types of batted balls than we would expect. This has dealt a pretty substantial blow to his value, as these hits would add up to more than 11 runs in value.

    BABIP luck and skill is one of the more interesting topics of conversation in the sabermetric world. The league average is around .300, and we don’t usually see much variation in the statistic, but that isn’t to say that batters don’t have an inherent skill as far as reaching base on balls in play. However, with a sample of 840 PAs with Bruce, we can’t really say for sure if there’s something about Bruce’s batted balls that lead to outs or if he’s just had poor luck. James’s projection system is operating on the assumption that there’s a large amount of luck at play with Bruce, and as such he projects a breakout year for the young outfielder.

    Jay Bruce will be one of the most interesting players to watch in the majors in 2010. He has incredible power and is a very toolsy player. The question is if he shows the potential he flashed in the minor leagues (AAA slugging percentage over .600) or if he continues to hit like a league average player.
    .


  2. Turn Off Ads?
  3. #2
    Member
    Join Date
    Apr 2001
    Location
    Indianapolis, IN
    Posts
    7,719

    Re: fangraphs article on Jay Bruce

    I think the important factor to consider in the article is the BABIP.
    One fallacy is to suppose that the correction to the mean will all occur within one year(as James suggests it will)

    I'm curious though, have there been players who had a low BABIP for their entire career?
    Alternatively have there been players who had a below average BABIP for 3-4 years and then it all of a sudden corrected itself?
    Quote Originally Posted by BuckeyeRed27 View Post
    Honest I can't say it any better than Hoosier Red did in his post, he sums it up basically perfectly.

  4. #3
    Charlie Brown All-Star IslandRed's Avatar
    Join Date
    May 2001
    Location
    Melbourne, FL
    Posts
    5,042

    Re: fangraphs article on Jay Bruce

    Quote Originally Posted by Will M View Post
    BABIP luck and skill is one of the more interesting topics of conversation in the sabermetric world. The league average is around .300, and we don’t usually see much variation in the statistic, but that isn’t to say that batters don’t have an inherent skill as far as reaching base on balls in play.
    There's a lot more variance with hitters, to the point where we shouldn't start with the default assumption that a hitter with a BABIP well away from .300 is a matter of luck, as we would with a pitcher. Since walks/HBPs etc. don't affect batting average or BABIP, that leaves hits on balls in play, strikeouts and home runs. A hitter whose BABIP is .300 can't actually hit over .300 unless he has more homers than strikeouts, and how often does that happen? Yet guys hit over .300 all the time, some of them consistently.
    Reading comprehension is not just an ability, it's a choice

  5. #4
    Sprinkles are for winners dougdirt's Avatar
    Join Date
    Jan 2006
    Posts
    49,393

    Re: fangraphs article on Jay Bruce

    Quote Originally Posted by Hoosier Red View Post
    I think the important factor to consider in the article is the BABIP.
    One fallacy is to suppose that the correction to the mean will all occur within one year(as James suggests it will)

    I'm curious though, have there been players who had a low BABIP for their entire career?
    Alternatively have there been players who had a below average BABIP for 3-4 years and then it all of a sudden corrected itself?
    I went through the data from 1970-2008 for all players with 3000 career at bats (6 seasons worth) and found 666 players (creepy). There were 2 players with a career BABIP under .250 during that time period. Wayne Gross and Graig Nettles.

    The key thing I wanted to look at though was players who tend to have the power that Bruce has shown. He has a current .220 career Isolated Power (SLG-AVG). Looking just at the guys on this list with an IsoP over .199 we are working with a sample of 116 players. That list had 5 guys under .260 and 13 under .270. The groups average BABIP was .299. Its just very rare to find guys who aren't 10 points from .300 one way or the other over a good sample size.

  6. #5
    Sprinkles are for winners dougdirt's Avatar
    Join Date
    Jan 2006
    Posts
    49,393

    Re: fangraphs article on Jay Bruce

    Quote Originally Posted by IslandRed View Post
    A hitter whose BABIP is .300 can't actually hit over .300 unless he has more homers than strikeouts, and how often does that happen? Yet guys hit over .300 all the time, some of them consistently.
    That isn't true. Here is the list since 1960 (as far as I have taken my database).

    Code:
    Name	        Year	AB	H	HR	K	AVG	BABIP
    Bonds, Barry	2001	476	156	73	93	.328	.268
    Bonds, Barry	2000	480	147	49	77	.306	.277
    Lee, Carlos	2006	624	187	37	65	.300	.287
    Mays, Willie	1965	558	177	52	71	.317	.287
    Mays, Willie	1962	621	189	49	85	.304	.287
    Piazza, Mike	1999	534	162	40	70	.303	.288
    Bell, George	1987	610	188	47	75	.308	.289
    Williams, Bil	1971	594	179	28	44	.301	.289
    Oglivie, Ben	1980	592	180	41	71	.304	.290
    Sheffield, Ga	1999	549	165	34	64	.301	.290
    Mattingly, Do	1989	631	191	23	30	.303	.291
    Simon, Randal	2002	482	145	19	30	.301	.291
    Garciaparra,	2006	469	142	20	30	.303	.291
    Thomas, Frank	1993	549	174	41	54	.317	.293
    Ramirez, Aram	2005	463	140	31	60	.302	.293
    Bonds, Barry	1996	517	159	42	76	.308	.293
    Pujols, Alber	2006	535	177	49	50	.331	.294
    Sheffield, Ga	1996	519	163	42	66	.314	.294
    McCovey, Will	1969	491	157	45	66	.320	.295
    Aaron, Hank	1971	495	162	47	58	.327	.295
    Thomas, Frank	1995	493	152	40	74	.308	.296
    Palmeiro, Raf	1995	554	172	39	65	.310	.296
    Belle, Albert	1995	546	173	50	80	.317	.296
    Griffey, Ken	1996	545	165	49	104	.303	.296
    Lee, Carlos	2007	627	190	32	63	.303	.297
    Brett, George	1977	564	176	22	24	.312	.297
    Brett, George	1983	464	144	25	39	.310	.298
    Powell, Boog	1969	533	162	37	76	.304	.298
    Belle, Albert	1996	602	187	48	87	.311	.298
    Walker, Larry	1995	494	151	36	72	.306	.298
    Sheffield, Ga	1998	437	132	22	46	.302	.298
    Ordonez, Magg	1999	624	188	30	64	.301	.298
    Guerrero, Vla	1999	610	193	42	62	.316	.298
    Staub, Rusty	1969	549	166	29	61	.302	.298
    Gonzalez, Jua	1996	541	170	47	82	.314	.299
    Giles, Brian	2001	576	178	37	67	.309	.299
    Garciaparra,	2003	658	198	28	61	.301	.299
    Mays, Willie	1961	572	176	40	77	.308	.299
    Griffey, Ken	1997	608	185	56	121	.304	.299
    Basically you have to either hit for a whole lot of power, or barely strike out to do it... but it can be done.
    Last edited by dougdirt; 11-24-2009 at 03:46 PM.

  7. #6
    Member NJReds's Avatar
    Join Date
    Jul 2004
    Location
    New Jersey, USA
    Posts
    5,435

    Re: fangraphs article on Jay Bruce

    Here's an article about BABIP that I found helpful.

    (link)

    Everything you always wanted to know about: BABIP

    Today's statistic: BABIP

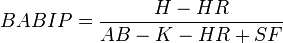
    What it stands for: Batting Average on Balls In Play

    How you calculate BABIP:


    What BABIP is good for: You often hear BABIP being brought up by stats-minded folks, but what does it actually mean? Simply put, BABIP tells us how many hits a player is getting — or a pitcher is giving up — when the ball is put in play. (In this case, "put in play" means the ball stays fair and in the ballpark, rather than the play resulting in a strikeout, walk, home run, hit by pitch or error.)

    If the batter's line drive rate remains constant, BABIP can be a good indictator of "luck" or random chance, which tends to even out over the course of a long season. If a lot of hits are falling when put into play, a hitter is usually due for a dry spell or a pitcher is usuall due for a break. If very few hits are falling, a hitter may be nearing a hot streak, while a hot pitcher may be due for an upcoming reality check.

    Why BABIP works: A well-known sabermetrician named Voros McCracken has demonstrated that pitchers have relatively high control over strikeouts, homers, and walks, but have relatively little control over balls in play. If a ball stays in play, the only things determining whether it will fall for a hit or turn into an out are the defense and random chance. This implies that the "pitching to contact" approach is either a myth or a byproduct of a stellar defense.

    How BABIP works for pitchers: For pitchers, BABIP tends to converge around .290 or .300. A pitcher whose BABIP is significantly higher than .300 will either wash out of the league or see it come down. Meanwhile, a pitcher whose BABIP is significantly lower than .300 will see it rise. There's generally not that much variance: Greg Maddux's(notes) career BABIP against was .286 while Jose Lima's(notes) was .301.

    A strikeout/flyout pitcher will generally have a higher BABIP than a groundball pitcher (Curt Schilling(notes), .297; Kevin Brown, .293), but the differences tend to be extremely minor.

    Knuckleballers tend to have an abnormally low BABIP: Tim Wakefield's(notes) is .275, and Phil Niekro's was .273. Nolan Ryan's career BABIP is an absurdly low .269, but he is an extreme case because he was both so dominating and wild that he didn't put the ball in play very often. Ryan is the all-time leader in both strikeouts and walks, eighth all-time in beanballs, and 35th all-time in home runs allowed.

    There is actually an ongoing dispute in the stat community as to whether a pitcher is capable of consciously affecting his BABIP. Brian Bannister(notes) of the Royals, perhaps the most stat-savvy player in the majors, gave an interview last year in which he revealed his efforts to improve his BABIP by throwing more strikes and getting into pitchers' counts.

    How BABIP works for hitters: For hitters there is more variance in BABIP, though the mean is obviously the same. Extremely speedy hitters tend to have a higher BABIP, because they are capable of beating out infield hits, like Ichiro Suzuki(notes) and his career BABIP of .357. Hitters less fleet of foot tend to have lower BABIPs. Free swingers like Vladimir Guerrero(notes) and Matt Diaz(notes), who manage to sustain high batting averages despite a cheerful disregard for the strike zone, have sustained accordingly high BABIPs — .319 for Guerrero and .362 for Diaz.

    Jimmy Rollins'(notes) awful 2009 was accompanied by a .245 BABIP, far off of his career .295 mark and the .303 BABIP he enjoyed during his 2007 MVP campaign.

    What accounted for the decline?

    For one thing, Rollins had fewer infield hits than ever before, just 10 in 2009 compared to 15 the previous year.

    For another, he had the fewest walks in any full season in his career — and tied for the second-fewest HBP — which meant that most every time he strode to the plate, he was putting himself into a position to make more outs. Had Rollins drawn more walks, leaned into a few more pitches and dragged a few more infield singles, he would have had more hits in fewer at-bats and his average would have been closer to the .277 he hit in 2006 and 2008.

    Rollins was unlucky in 2009, but he was also lucky in 2007, when he set personal bests in PA, AB, runs, hits, triples, homers, RBI, batting average, slugging, and OPS, en route to winning the MVP. Luck breaks both ways. BABIP isn't the reason he did poorly; it's just merely a measure of how poorly he did.

    When BABIP doesn't work: As I just said, BABIP is not a determinant of success, it's only a measure of what's going on. It's only a byproduct of all the things that batters and pitchers have no control over — the little bounces and breaks and streaks that sometimes even out over the course of a season and sometimes can carry a guy to a career high or a career low.

    Random chance isn't the only reason a player might fail. Persistently low hitter BABIPs or high pitcher BABIPs might be an indication of poor mechanics, injury, or insufficient skill or talent. There's wild BABIP variance in the minor leagues, where the talent spread is a lot wider.

    Why we care about BABIP: Once you know how it works, it's very easy to eyeball and predict whether someone is likely to do better or worse. BABIP-based predictions certainly aren't perfect — and one should guard against attributing all the variation in a player's BABIP to "luck" — but it is quick and easy and it is very useful if you keep that warning in mind. I use it constantly when writing my Slumpbot and Streaking columns, because I know that BABIP should be around .300, and if a player's BABIP is too high or too low, then I can make a prediction for whether his streak or slump is likely to end in the near future.
    "The players make the manager, it's never the other way." - Sparky Anderson

  8. #7
    Member
    Join Date
    Apr 2007
    Posts
    4,761

    Re: fangraphs article on Jay Bruce

    The part of the article posted on BABIP by NJReds that I believe to be key is the assumption that the LD% percentage remains constant. Line drives are more likely to get through the infield or fall safely in the outfield than other types of batted balls that remain in play. I suspect that there is high correlation between LD% and BABIP.

    The part of Bruce's batting statistics that stands out to me is the difference in LD% between his first and second years (21.1% vs 13.0%). Is the variation in LD% a result of chance or was Bruce's approach different for much of 2009? In an attempt to pull more balls for HR's, did he hit more lazy fly balls and pop ups?

  9. #8
    Sprinkles are for winners dougdirt's Avatar
    Join Date
    Jan 2006
    Posts
    49,393

    Re: fangraphs article on Jay Bruce

    Quote Originally Posted by RED VAN HOT View Post
    The part of the article posted on BABIP by NJReds that I believe to be key is the assumption that the LD% percentage remains constant. Line drives are more likely to get through the infield or fall safely in the outfield than other types of batted balls that remain in play. I suspect that there is high correlation between LD% and BABIP.

    The part of Bruce's batting statistics that stands out to me is the difference in LD% between his first and second years (21.1% vs 13.0%). Is the variation in LD% a result of chance or was Bruce's approach different for much of 2009? In an attempt to pull more balls for HR's, did he hit more lazy fly balls and pop ups?
    The average major leaguer falls in the 18-22% LD Rate range. Bruce certainly showed some swing flaws for parts of the season that were likely the reason for the higher FB rate and lower LD rate. Even still, his balls in play suggest his BABIP should have still ben about 40 points higher than it was.

  10. #9
    Charlie Brown All-Star IslandRed's Avatar
    Join Date
    May 2001
    Location
    Melbourne, FL
    Posts
    5,042

    Re: fangraphs article on Jay Bruce

    Quote Originally Posted by dougdirt View Post
    That isn't true. Here is the list since 1960 (as far as I have taken my database). (snip) Basically you have to either hit for a whole lot of power, or barely strike out to do it... but it can be done.
    Yeah, my equation was a little off. Thanks.
    Reading comprehension is not just an ability, it's a choice

  11. #10
    Member
    Join Date
    Jan 2001
    Posts
    35,507

    Re: fangraphs article on Jay Bruce

    Quote Originally Posted by RED VAN HOT View Post

    The part of Bruce's batting statistics that stands out to me is the difference in LD% between his first and second years (21.1% vs 13.0%). Is the variation in LD% a result of chance or was Bruce's approach different for much of 2009? In an attempt to pull more balls for HR's, did he hit more lazy fly balls and pop ups?

    This was discussed at length during the season. Thirteen percent LD rate is too low. Bruce needs to improve that number. His swing seemed improved after he returned from injury. Earlier in the season, he was hitting a lot of pop flies.


Turn Off Ads?

Posting Permissions

  • You may not post new threads
  • You may not post replies
  • You may not post attachments
  • You may not edit your posts
  •  

Board Moderators may, at their discretion and judgment, delete and/or edit any messages that violate any of the following guidelines: 1. Explicit references to alleged illegal or unlawful acts. 2. Graphic sexual descriptions. 3. Racial or ethnic slurs. 4. Use of edgy language (including masked profanity). 5. Direct personal attacks, flames, fights, trolling, baiting, name-calling, general nuisance, excessive player criticism or anything along those lines. 6. Posting spam. 7. Each person may have only one user account. It is fine to be critical here - that's what this board is for. But let's not beat a subject or a player to death, please.

Thank you, and most importantly, enjoy yourselves!


RedsZone.com is a privately owned website and is not affiliated with the Cincinnati Reds or Major League Baseball


Contact us: Boss | Gallen5862 | Plus Plus | Powel Crosley | RedlegJake | The Operator